Aviação
-
Voo direto entre Campo Grande e Foz do Iguaçu ligará os maiores destinos de ecoturismo do Brasil
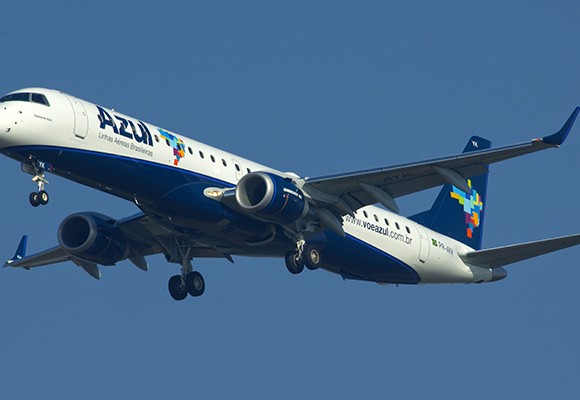
Campo Grande (MS) – Já está sendo comercializado pela Azul Linhas Aéreas o novo voo direto entre a capital de Mato Grosso do Sul e Foz do Iguaçu, com início da operação marcada para a segunda quinzena do mês de dezembro. A rota, que liga diretamente os dois principais destinos de ecoturismo do Brasil, é uma reivindicação antiga do trade turístico de Mato Grosso do Sul, pois vai facilitar a entrada de turistas estrangeiros que vêm da cidade paranaense em busca de destinos como Pantanal e Bonito, considerado o melhor destino de ecoturismo do país.
Com saídas diárias às 19h, o voo AD9090 fará o trecho Campo Grande x Foz do Iguaçu e o voo AD9091 fará Foz do Iguaçu x Campo Grande, com saídas às 8h30. A estratégia da Fundação de Turismo de Mato Grosso do Sul de captação de novos voos para o estado, está inserida nas ações estruturais de posicionamento de mercado. E este é o primeiro resultado das negociações com as companhias aéreas iniciadas no primeiro semestre deste ano na WTM/LA, em São Paulo, uma das principais feiras de turismo da América Latina.
O diretor-presidente da Fundtur-MS, Bruno Wendling, explica que a Fundação de Turismo do Mato Grosso do Sul e a Secretaria de Turismo, Indústria, Comércio e Projetos Estratégicos de Foz do Iguaçu se uniram para promover essa nova rota. Com o advento do novo voo, espera-se cerca de 20% de crescimento de fluxo de turistas no MS, principalmente os internacionais, que antes só tinham a opção de acesso rodoviário para fazer a rota Foz do Iguaçu/Campo Grande. Segundo Wendling, o acesso aéreo aos destinos sul-mato-grossenses sempre foi um dos gargalos para o incremento no fluxo de turistas e isso é uma questão prioritária para o desenvolvimento do turismo.
Para Ney Gonçalves, vice-presidente de Turismo Especializado da ABAV Nacional, a ponte aérea Campo Grande – Foz do Iguaçu é de grande importância para o setor. “Essa ligação entre os principais polos de ecoturismo do Brasil, que são Bonito e Foz, é de grande importância para o setor e é esperada há muito tempo não só pelos empresários, mas também pelos próprios clientes que querem fazer a rota Foz do Iguaçu e os destinos Pantanal e Bonito. Esse voo é um desejo antigo e que com certeza vai aumentar o fluxo de turistas para os destinos dos dois estados”, salienta.
O presidente da Associação Brasileira da Indústria de Hotéis do Mato Grosso do Sul (ABIH/MS), Marcelo Mesquita, se diz bastante otimista com o novo voo direto. “Nós da ABIH/MS, associação que representa a maioria dos hotéis de Campo Grande e do interior do estado, estamos muito contentes e bastante otimistas com esse voo que está começará a ser operado em dezembro, pois ele conecta essa rota tão importante que é Foz do Iguaçu, Campo Grande e demais regiões do estado. Achamos essa ação muito estratégica porque fortalece ainda mais Mato Grosso do Sul como destino de ecoturismo. Acredito que isso vai impulsionar ainda mais a hotelaria, mas também vai impactar outros segmentos no mercado”.Turismo receptivo de Mato Grosso do Sul
A capital de Mato Grosso do Sul, Campo Grande, é uma das capitais com melhor qualidade de vida do Brasil, onde o turismo de Negócios e Eventos é o carro-chefe do setor. No ecoturismo, a região de Bonito-Serra da Bodoquena, é referência em turismo responsável. Destaque para Bonito, que foi eleito por 14 vezes o melhor destino de ecoturismo do Brasil pelos leitores da revista Viagem e Turismo. O destino também ganhou o prêmio de turismo responsável, o World Responsible Tourism Awards, em 2013.
Cerca de 65% do Pantanal, uma das mais exuberantes e diversificadas reservas naturais do planeta e reconhecido pela UNESCO como Patrimônio Natural da Humanidade, está localizado em Mato Grosso do Sul. É um paraíso para observadores e fotógrafos de fauna e flora e a maioria das fazendas localizadas no Pantanal não só oferece boa infraestrutura e atendimento ao turista como também apresentam conscientização ecológica e manutenção das tradições da cultura do homem pantaneiro. Em 2015, o Pantanal foi eleito o 4º melhor destino para apreciação de vida selvagem no mundo e hoje é um dos destinos brasileiros mais procurados pelo turismo nacional e internacional. -
Air Europa inicia projeto de lives “Bilhete 996” em parceria com TV Aratu.
Encontros acontecerão a cada 15 dias com a participação de convidados e dicas de destinos incríveis
A Air Europa, em parceria com a TV Aratu, da Bahia, lançou ontem (19), o projeto de lives “Bilhete 996”. O programa é veiculado quinzenalmente no Facebook da TV Aratu, às 9h30 e é apresentado pelo jornalista Jean Mendes. A live tem duração de 25 minutos e, além, é claro, da participação dos seguidores da página, o programa conta com as presenças de convidados do setor que debatem as melhores dicas de rotas e destinos. Sobre a Air EuropaO tema escolhido para inaugurar o projeto foi “Dia do Pais” e as convidadas Heloísa Braga jornalista especializada em turismo e Adriana Virgílio, diretora comercial da Flytour Viagens de Salvador, comentaram os passeios mais indicados e incríveis por países europeus como Itália, Bélgica, Alemanha e Espanha. O conteúdo completo da live pode ser acessado neste link.

O projeto contempla programas de 25 minutos cada, e será exibido até dezembro deste ano. A próxima live Bilhete 996 acontece no dia 02/08, às 9h30, na página da Aratu online https://www.facebook.com/aratuonline/. No blog da Air Europa “Bilhete 996” é possível encontrar mais dicas. Confira!
Fundada em 1986, a Air Europa Linhas Aéreas é membro da aliança global Skyteam e a única aérea espanhola privada com mais de 25 anos de experiência em voos regulares. A companhia integra a rede Globalia, 3º maior grupo de turismo da Europa e 1º da Espanha. Sua frota de 50 aeronaves voa diretamente para 48 destinos – 15 nas Américas, 13 na Europa/Norte da África e 20 na Espanha. Há 15 anos no Brasil, atualmente opera doze voos semanais diretos para Madri, partindo de três cidades brasileiras. Sete a partir de Guarulhos (SP), diários, três de Salvador (BA), às terças, quintas e sábados e dois de Recife (PE), às quartas e sextas-feiras. Recentemente, a Air Europa adicionou a cidade de São Paulo à sua rede de destinos Dreamliner, passando a operar seu voo diário com um Boeing 787-8, uma das aeronaves mais modernas da atualidade. Para mais informações sobre a Air Europa, acesse: www.aireuropa.com. -
Mobility entrega prêmio para agências de viagens.
Atendimento e prestação de serviços Premium foram alguns dos reconhecimentos
que levou mais de dez agências a se destacarem no mercado de turismo de luxo
A ação é resultado do Agente Satturno, clube de fidelidade e benefícios criado pela Mobility – líder mundial do setor de locação de veículos no mercado B2B – que visa reconhecer a atuação das agências que se destacam no mercado triple A. Com menos de seis meses de vigência, o Clube já conta com mais de 25 agências e, no último dia 26 de junho, reconheceu o potencial de um seleto grupo por seu know-how. Aqui Viagens, Embarque Turismo, ESP Viagens, Ilhatur Blumenau, LTN Lazer e Eventos Viagens e Turismo, Matueté, Nova Safari RJ e SP, Orinter, Paragon, Personal Travel VIP, PHD, Plantel, Primetour, Selections, Sete Mares, Softour, Teresa Perez, Shilton, Travel Place e Unitour BH foram as contempladas.
Mais que valorizar e oferecer benefícios com locadoras boutiques, atendimento preferencial e eventos exclusivos para as agências de viagens, o Agente Satturno traz também uma série de vantagens para o cliente como, por exemplo, o acréscimo de 5h na última diária e pacote de milhas/KM extra.
“Seja a trabalho ou a lazer, o período de viagem deve ser bem planejado para evitar possíveis aborrecimentos e frustrações. Não importa o motivo, todos querem um lugar agradável, um hotel com boa infraestrutura e gastronomia. Tudo isso significa experiências. Por isso, acreditamos que o trabalho dos agentes de viagens é fundamental no pré ao pós-viagem”, diz Oskar Kedor, CEO da Mobility.
É por estes motivos que a Mobility investe e reconhece a importância dos profissionais de turismo, por meio de prêmios, benefícios e até ações de marketing, como a campanha Futuro do Rent a Car, que levará seis agentes para o Vale do Silício. Só que antes do embarque os participantes têm uma rodada de conhecimento, interação e aprimoramento. Mais informações sobre a ação, que termina do dia 20 de julho:https://futurorentacar.com.br.
Sobre a Mobility
Considerada uma das líderes de locação de automóveis, a Mobility é referência nacional e internacional em serviços de carros de luxo, motos, motorhomes e atendimento de transporte executivo de alto padrão. Com 18 anos de atuação, a marca está presente em 190 países e, atualmente, detém 25% do mercado no exterior. Seu sucesso e reputação estão atrelados a sua metodologia exclusiva de comparação de preços, as tarifas diferenciadas, ao atendimento personalizado e a preocupação de sempre gerar novas experiências à sua base de clientes e as mais de três mil agências de viagens credenciadas, totalizando cerca de 10 mil agentes de viagens. Além disso, tem alianças estratégicas com as principais locadoras mundiais e, no segmento de luxo, é a central de reservas exclusiva da Elite (na Europa), Midway e First Class – ambas nos EUA.www.mobility.com.br
Wellington Martins – Turismo em Pauta 2018.
-
Passenger Demand Continues Strong Growth in May.
The International Air Transport Association (IATA) announced global
passenger traffic results for May showing that demand (measured in revenue passenger
kilometers, or RPKs) rose 6.1% compared to the same month in 2017, which was a slight
pickup from 6.0% year-over-year growth for April 2018. Capacity climbed 5.9% and load factor
rose 0.1 percentage point to 80.1%.
“May was another solid month in terms of demand growth. As had been expected, we saw
some moderation, as rising airline costs are reducing the stimulus from lower airfares. In
particular, jet fuel prices are expected to be up nearly 26% this year compared to 2017.
Nevertheless, the record load factor for the month signifies that demand for air connectivity is
strong,” said Alexandre de Juniac, IATA’s Director General and CEO.
Air passenger market detail – May 2018RPK1ASK1PLF (%-pt)2PLF (level)3RPK1ASK1PLF (%-pt)2PLF (level)3
TOTAL MARKET100.0%6.1%5.9%0.1%80.1%6.8%6.0%0.6%81.0%
Africa2.2%-0.8%-0.9%0.0%66.8%2.3%1.2%0.7%70.1%
Asia Pacific33.7%8.7%8.6%0.1%79.6%9.4%8.6%0.6%81.4%
Europe26.5%6.0%5.0%0.8%83.0%6.5%5.1%1.1%82.6%
Latin America5.2%6.1%6.2%-0.1%79.8%6.9%6.1%0.6%81.6%
Middle East9.5%0.5%3.3%-1.9%67.5%3.8%3.8%0.0%74.2%
North America23.0%5.2%4.9%0.3%84.4%5.0%4.6%0.3%82.7%
International63.8%5.8%5.4%0.3%78.7%6.5%5.6%0.7%80.1%
Africa1.9%3.8%3.2%0.4%66.4%6.3%4.5%1.2%69.7%
Asia Pacific18.5%8.0%7.6%0.3%77.9%8.1%7.5%0.5%80.1%
Europe23.7%6.2%5.1%0.8%83.5%6.4%5.1%1.0%83.2%
Latin America2.8%7.5%7.0%0.4%81.6%8.7%8.2%0.4%82.0%
Middle East9.1%0.8%3.7%-1.9%67.5%3.8%4.0%-0.2%74.3%
North America7.8%4.9%3.4%1.2%82.0%5.3%3.9%1.0%81.0%
Domestic36.2%6.6%6.7%-0.1%82.6%7.4%6.7%0.5%82.5%
Dom. Australia40.9%1.7%2.5%-0.6%75.2%3.4%1.6%1.4%78.1%
Domestic Brazil41.2%4.1%5.4%-1.0%76.9%4.8%4.2%0.4%80.7%
Dom. China P.R.49.1%11.9%12.5%-0.5%83.4%12.7%12.8%-0.1%84.4%
Domestic India41.4%16.6%18.0%-1.1%87.5%22.0%18.0%2.9%88.8%
Domestic Japan41.1%1.8%1.4%0.3%69.4%3.1%1.5%1.1%69.8%
Dom. Russian Fed.41.4%8.6%7.5%0.8%78.5%7.1%4.0%2.3%78.1%
Domestic US414.5%5.5%5.8%-0.3%85.9%5.0%5.1%-0.1%83.7%
1
% of industry RPKs in 20172Year-on-year change in load factor3Load factor levelWorld
share1May 2018 (% year-on-year)% year-to-date
4
Note: the seven domestic passenger markets for which broken-down data are available account for 30% of global total RPKs and approximately
82% of total domestic RPKs
Note: the total industry and regional growth rates are based on a constant sample of airlines combining reported data and estimates for missing
observations. Airline traffic is allocated according to the region in which the carrier is registered; it should not be considered as regional traffic.International Passenger Markets
International passenger traffic demand rose 5.8%, which was up from 4.6% growth in April. All
regions recorded growth, led by Asia-Pacific airlines. Total capacity climbed 5.4%, with load
factor rising 0.3 percentage point to 78.7%.
Asia-Pacific airlines saw their traffic rise 8.0% in May compared to the year-ago period,
slightly down on an 8.1% increase in April. Capacity increased 7.6%, and load factor
edged up 0.3 percentages point to 77.9%. Passenger traffic has continued to trend
strongly upwards in seasonally-adjusted terms, buoyed by a combination of robust
regional economic growth and increases in the number of route options for travelers.
European carriers’ May demand climbed 6.2% over May 2017, well above the 3.4%
year-over-year growth recorded in April. Capacity rose 5.1% and load factor was up 0.8
percentage point to 83.5%, which was the highest among regions. Despite the impact of
strikes in the region and mixed signals regarding the economic backdrop, traffic growth
is healthy.
Middle East carriers’ May demand growth slowed to 0.8% compared to a year ago,
from 2.9% annual growth recorded in April. The earlier timing of Ramadan this year may
have affected the result, but more broadly, the upward trend in traffic has slowed
compared to last year. May capacity increased 3.7%, and load factor fell 1.9 percentage
points to 67.5%.
North American airlines’ traffic rose 4.9% in May compared to May 2017, a strong
rebound from 0.9% annual growth in April (which was a 36-month low). Capacity climbed
3.4% and load factor increased 1.2 percentage points to 82.0%. Given the comparatively
strong US domestic economy, April’s weak demand performance likely was more
reflective of unfavorable year-to-year comparisons with April 2017, when the current
upsurge in growth began.
Latin American airlines experienced a 7.5% increase in traffic in May compared to the
same month last year, which was up from 6.5% growth in April. Capacity climbed 7.0%
and load factor rose 0.4 percentage points to 81.6%. Economic disruption in Brazil may
be contributing to a slight slowdown in demand growth in recent months, but this is not
expected to have a long-term impact on the healthy traffic trend.
African airlines’ traffic rose 3.8% in May compared to the year-ago period, which was
an 8-month low. Capacity rose 3.2% and load factor edged up 0.4 percentage point to
66.4%. The region’s two largest economies, Nigeria and South Africa, may be moving in
opposite directions again, with higher oil prices bolstering the Nigerian economy, while
business confidence in South Africa has weakened again.
Domestic Passenger Markets
Domestic demand rose 6.6% in May compared to May 2017, led by growth in China and India.
This was down from the 8.6% year-on-year growth recorded in April largely owing to moderate
growth in both countries, although each continued to post double-digit traffic gains.Air passenger market detail – May 2018
RPK1ASK1PLF (%-pt)2PLF (level)3RPK1ASK1PLF (%-pt)2PLF (level)3
TOTAL MARKET100.0%6.1%5.9%0.1%80.1%6.8%6.0%0.6%81.0%
Africa2.2%-0.8%-0.9%0.0%66.8%2.3%1.2%0.7%70.1%
Asia Pacific33.7%8.7%8.6%0.1%79.6%9.4%8.6%0.6%81.4%
Europe26.5%6.0%5.0%0.8%83.0%6.5%5.1%1.1%82.6%
Latin America5.2%6.1%6.2%-0.1%79.8%6.9%6.1%0.6%81.6%
Middle East9.5%0.5%3.3%-1.9%67.5%3.8%3.8%0.0%74.2%
North America23.0%5.2%4.9%0.3%84.4%5.0%4.6%0.3%82.7%
International63.8%5.8%5.4%0.3%78.7%6.5%5.6%0.7%80.1%
Africa1.9%3.8%3.2%0.4%66.4%6.3%4.5%1.2%69.7%
Asia Pacific18.5%8.0%7.6%0.3%77.9%8.1%7.5%0.5%80.1%
Europe23.7%6.2%5.1%0.8%83.5%6.4%5.1%1.0%83.2%
Latin America2.8%7.5%7.0%0.4%81.6%8.7%8.2%0.4%82.0%
Middle East9.1%0.8%3.7%-1.9%67.5%3.8%4.0%-0.2%74.3%
North America7.8%4.9%3.4%1.2%82.0%5.3%3.9%1.0%81.0%
Domestic36.2%6.6%6.7%-0.1%82.6%7.4%6.7%0.5%82.5%
Dom. Australia40.9%1.7%2.5%-0.6%75.2%3.4%1.6%1.4%78.1%
Domestic Brazil41.2%4.1%5.4%-1.0%76.9%4.8%4.2%0.4%80.7%
Dom. China P.R.49.1%11.9%12.5%-0.5%83.4%12.7%12.8%-0.1%84.4%
Domestic India41.4%16.6%18.0%-1.1%87.5%22.0%18.0%2.9%88.8%
Domestic Japan41.1%1.8%1.4%0.3%69.4%3.1%1.5%1.1%69.8%
Dom. Russian Fed.41.4%8.6%7.5%0.8%78.5%7.1%4.0%2.3%78.1%
Domestic US414.5%5.5%5.8%-0.3%85.9%5.0%5.1%-0.1%83.7%
1
% of industry RPKs in 20172Year-on-year change in load factor3Load factor levelWorld
share1May 2018 (% year-on-year)% year-to-date
4
Note: the seven domestic passenger markets for which broken-down data are available account for 30% of global total RPKs and approximately
82% of total domestic RPKs
Note: the total industry and regional growth rates are based on a constant sample of airlines combining reported data and estimates for missing
observations. Airline traffic is allocated according to the region in which the carrier is registered; it should not be considered as regional traffic.
Air passenger market detail – May 2018RPK1ASK1PLF (%-pt)2PLF (level)3RPK1ASK1PLF (%-pt)2PLF (level)3
TOTAL MARKET100.0%6.1%5.9%0.1%80.1%6.8%6.0%0.6%81.0%
Africa2.2%-0.8%-0.9%0.0%66.8%2.3%1.2%0.7%70.1%
Asia Pacific33.7%8.7%8.6%0.1%79.6%9.4%8.6%0.6%81.4%
Europe26.5%6.0%5.0%0.8%83.0%6.5%5.1%1.1%82.6%
Latin America5.2%6.1%6.2%-0.1%79.8%6.9%6.1%0.6%81.6%
Middle East9.5%0.5%3.3%-1.9%67.5%3.8%3.8%0.0%74.2%
North America23.0%5.2%4.9%0.3%84.4%5.0%4.6%0.3%82.7%
International63.8%5.8%5.4%0.3%78.7%6.5%5.6%0.7%80.1%
Africa1.9%3.8%3.2%0.4%66.4%6.3%4.5%1.2%69.7%
Asia Pacific18.5%8.0%7.6%0.3%77.9%8.1%7.5%0.5%80.1%
Europe23.7%6.2%5.1%0.8%83.5%6.4%5.1%1.0%83.2%
Latin America2.8%7.5%7.0%0.4%81.6%8.7%8.2%0.4%82.0%
Middle East9.1%0.8%3.7%-1.9%67.5%3.8%4.0%-0.2%74.3%
North America7.8%4.9%3.4%1.2%82.0%5.3%3.9%1.0%81.0%
Domestic36.2%6.6%6.7%-0.1%82.6%7.4%6.7%0.5%82.5%
Dom. Australia40.9%1.7%2.5%-0.6%75.2%3.4%1.6%1.4%78.1%
Domestic Brazil41.2%4.1%5.4%-1.0%76.9%4.8%4.2%0.4%80.7%
Dom. China P.R.49.1%11.9%12.5%-0.5%83.4%12.7%12.8%-0.1%84.4%
Domestic India41.4%16.6%18.0%-1.1%87.5%22.0%18.0%2.9%88.8%
Domestic Japan41.1%1.8%1.4%0.3%69.4%3.1%1.5%1.1%69.8%
Dom. Russian Fed.41.4%8.6%7.5%0.8%78.5%7.1%4.0%2.3%78.1%
Domestic US414.5%5.5%5.8%-0.3%85.9%5.0%5.1%-0.1%83.7%
1
% of industry RPKs in 20172Year-on-year change in load factor3Load factor levelWorld
share1May 2018 (% year-on-year)% year-to-date
4
Note: the seven domestic passenger markets for which broken-down data are available account for 30% of global total RPKs and approximately
82% of total domestic RPKs
Note: the total industry and regional growth rates are based on a constant sample of airlines combining reported data and estimates for missing
observations. Airline traffic is allocated according to the region in which the carrier is registered; it should not be considered as regional traffic.
India’s domestic traffic rose 16.6% year-over-year, which was down from 25.7% in April.
Passenger volumes in India have fallen back in seasonally-adjusted terms in recent
months alongside some mixed signals on the economic front. Notwithstanding this, May
was India’s 45th consecutive month of double-digit annual RPK growth. Demand
continues to be supported by strong growth in the number of airport connections within
the country: some 22% more airport-pairs are scheduled to operate in 2018 compared
to last year.
US domestic traffic experienced a mild pick-up in May, with 5.5% year-over-year traffic
growth, up from 5.3% in April. This partly offset the moderate growth in China and India.
Domestic traffic is trending upward at an annualized rate of around 7%, helped by the
comparatively strong US economy.
The Bottom Line
“Last month, IATA released its mid-year economic report showing expectations of an industry
net profit of $33.8 billion. This is a solid performance. But our buffer against shocks is just $7.76.
That’s the average profit per passenger that airlines will make this year—a narrow 4.1% net
margin. And there are storm clouds on the horizon, including rising cost inputs, growing
protectionist sentiment and the risk of trade wars, as well as geopolitical tensions. Aviation is the
business of freedom, liberating people to lead better lives. Governments that recognize this will
take steps to ensure aviation is economically sustainable. And aviation works best when
borders are open to trade and people,” said de Juniac.
-IATA-For more information, please contact:
Corporate Communications
Tel: +41 22 770 2967
Email: corpcomms@iata.orgNotes for Editors:
IATA (International Air Transport Association) represents some 290 airlines comprising
82% of global air traffic.
You can follow us at http://twitter.com/iata2press for news specially catered for the
media.
All figures are provisional and represent total reporting at time of publication plus
estimates for missing data. Historic figures may be revised.
Domestic RPKs accounted for about 36% of the total market. It is most important for
North American airlines as it is about 66% of their operations. In Latin America, domestic
travel accounts for 46% of operations, primarily owing to the large Brazilian market. For
Asia-Pacific carriers, the large markets in India, China and Japan mean that domestic
travel accounts for 45% of the region’s operations. It is less important for Europe and
most of Africa where domestic travel represents just 11% and 14% of operations,
respectively. And it is negligible for Middle Eastern carriers for whom domestic travel
represents just 4% of operations.
Explanation of measurement terms:
o RPK: Revenue Passenger Kilometers measures actual passenger traffic
o ASK: Available Seat Kilometers measures available passenger capacity
o PLF: Passenger Load Factor is % of ASKs used.
IATA statistics cover international and domestic scheduled air traffic for IATA member
and non-member airlines.
Total passenger traffic market shares by region of carriers in terms of RPK are: Asia-
Pacific 33.7%, Europe 26.5%, North America 23.0%, Middle East 9.5%, Latin America
5.2%, and Africa 2.2%. -
Novo aplicativo SkyShop- Air Europa
Confira essa e outras novidades em nossa página Air Europa Brasil no Facebook
Wellington Martins – Turismo em Pauta 2018.
