
IATA release – Demanda de passageiros em fevereiro
Passenger Demand Plunges on COVID-19 Travel
Restrictions
2 April 2020 (Geneva) – The International Air Transport Association (IATA) announced global
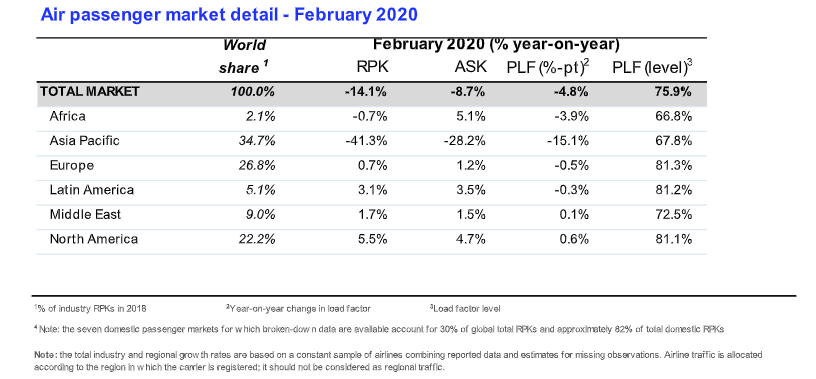
passenger traffic data for February 2020 showing that demand (measured in total revenue
passenger kilometers or RPKs) fell 14.1% compared to February 2019. This was the steepest
decline in traffic since 9.11 and reflected collapsing domestic travel in China and sharply falling
international demand to/from and within the Asia-Pacific region, owing to the spreading COVID-
19 virus and government-imposed travel restrictions. February capacity (available seat
kilometers or ASKs) fell 8.7% as airlines scrambled to trim capacity in line with plunging traffic,
and load factor fell 4.8 percentage points to 75.9%.
“Airlines were hit by a sledgehammer called COVID-19 in February. Borders were closed in an
effort to stop the spread of the virus. And the impact on aviation has left airlines with little to do
except cut costs and take emergency measures in an attempt to survive in these extraordinary
circumstances. The 14.1% global fall in demand is severe, but for carriers in Asia-Pacific the
drop was 41%. And it has only grown worse. Without a doubt this is the biggest crisis that the
industry has ever faced,” said Alexandre de Juniac, IATA’s Director General and CEO.
International Passenger Markets
February international passenger demand fell 10.1% compared to February 2019, the worst
outcome since the 2003 SARS outbreak and a reversal from the 2.6% traffic increase recorded
in January. Europe and Middle East were the only regions to see a year-over-year traffic rise.
Capacity fell 5.0%, and load factor plunged 4.2 percentage points to 75.3%.
Asia-Pacific airlines’ February traffic plummeted 30.4% compared to the year-ago
period, steeply reversing a 3.0% gain recorded in January. Capacity fell 16.9% and load
factor collapsed to 67.9%, a 13.2-percentage point drop compared to February 2019.
European carriers’ February demand was virtually flat compared to a year ago (+0.2%),
the region’s weakest performance in a decade. The slowdown was driven by routes
to/from Asia, where the growth rate slowed by 25 percentage points in February, versus
January. Demand in markets within Europe performed solidly despite some initial flight
suspensions on the routes to/from Italy. However, March data will reflect the impact of
the spread of the virus across Europe and the related disruptions to travel. February
capacity rose 0.7%, and load factor slipped 0.4 percentage point to 82.0%, which was
the highest among regions.
Middle Eastern airlines posted a 1.6% traffic increase in February, a slowdown from
the 5.3% year-over-year growth reported in January largely owing to a slowdown on
Middle East-Asia-Pacific routes. Capacity increased by 1.3%, and load factor edged up
0.2 percentage point to 72.6%.
North American carriers had a 2.8% traffic decline in February, reversing a 2.9% gain
in January, as international entry restrictions hit home and volumes on Asia-North
America routes plunged 30%. Capacity fell 1.5%, and load factor dropped 1.0
percentage point to 77.7%.
Latin American airlines experienced a 0.4% demand drop in February compared to the
same month last year. This actually was an improvement over the 3.5% decline
recorded in January. However, the spread of the virus and resulting travel restrictions
will be reflected in March results. Capacity also fell 0.4% and load factor was flat
compared to February 2019 at 81.3%.
African airlines’ traffic slipped 1.1% in February, versus a 5.6% traffic increase
recorded in January and the weakest outcome since 2015. The decline was driven by
around a 35% year-on-year traffic fall in the Africa-Asia market. Capacity rose 4.8%,
however, and load factor sagged 3.9 percentage points to 65.7%, lowest among regions.
Domestic Passenger Markets
Demand for domestic travel dropped 20.9% in February compared to February 2019, as
Chinese domestic market collapsed in the face of the government lockdown. Domestic capacity
fell 15.1% and load factor dropped 5.6 percentage points to 77.0%.
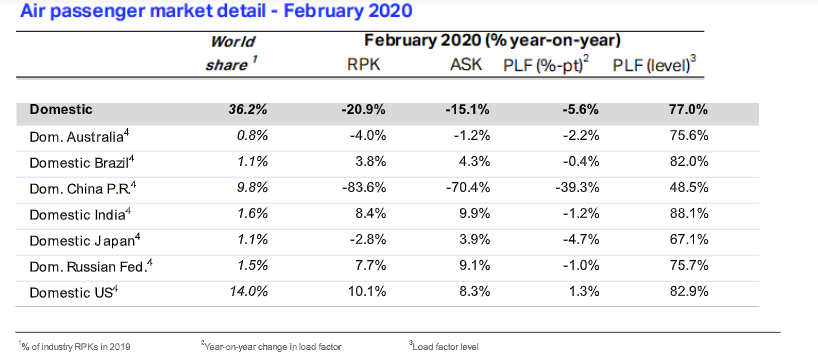
Chinese airlines’ domestic traffic fell 83.6% in February, the worst outcome since IATA
began tracking the market in 2000. With the easing of some restrictions on internal travel
in March, domestic demand is showing some tentative signs of improvement.
US airlines enjoyed one of their strongest months in February, as domestic traffic
jumped 10.1%. Demand fell toward the end of the month, however, with the full impact
of COVID-19 expected to show in March results.
The Bottom Line
“This is aviation’s darkest hour and it is difficult to see a sunrise ahead unless governments do
more to support the industry through this unprecedented global crisis. We are grateful to those
that have stepped up with relief measures, but many more need to do so. Our most recent
analysis shows that airlines may burn through $61 billion of their cash reserves during the
second quarter ending 30 June 2020. This includes $35 billion in sold-but-unused tickets as a
result of massive flight cancellations owing to government-imposed travel restrictions. We
welcome the actions of those regulators who have relaxed rules so as to permit airlines to issue
travel vouchers in lieu of refunds for unused tickets; and we urge others to do the same. Air
transport will play a much-needed role in supporting the inevitable recovery. But without
additional government action today, the industry will not be in a position to help when skies are
brighter tomorrow,” said de Juniac.
For more information, please contact:
Corporate Communications
Tel: +41 22 770 2967
Email: corpcomms@iata.org
Notes for Editors:
IATA (International Air Transport Association) represents some 290 airlines comprising
82% of global air traffic.
You can follow us at https://twitter.com/iata for announcements, policy positions, and
other useful industry information.
All figures are provisional and represent total reporting at time of publication plus
estimates for missing data. Historic figures are subject to revision.
Domestic RPKs accounted for about 36% of the total market. It is most important for
North American airlines as it is about 66% of their operations.
Explanation of measurement terms:
o RPK: Revenue Passenger Kilometers measures actual passenger traffic
o ASK: Available Seat Kilometers measures available passenger capacity
o PLF: Passenger Load Factor is % of ASKs used.
IATA statistics cover international and domestic scheduled air traffic for IATA member
and non-member airlines.
Total passenger traffic market shares by region of carriers in terms of RPK are: Asia-
Pacific 34.7%, Europe 26.8%, North America 22.2%, Middle East 9.0%, Latin America
5.1%, and Africa 2.1%.
Você pode gostar

Net-Zero Carbon Emissions by 2050.
PRESS RELEASE No 60 September Air Freight Volumes Remain Weak 07 November 2019 (Geneva) .